Products
Solutions
Resources
9977 N 90th Street, Suite 250 Scottsdale, AZ 85258 | 1-800-637-7496
© 2024 InEight, Inc. All Rights Reserved | Privacy Statement | Terms of Service | Cookie Policy | Do not sell/share my information

The Package Milestone dashboard lets you see information about user-defined milestones in the procurement process over time. A second tab details bid package information at the line item level with the ability to link back to InEight products.
From the Dashboards page, click the Package Milestone dashboard.

Select a Project drop-down title.
Close the Dashboards panel.
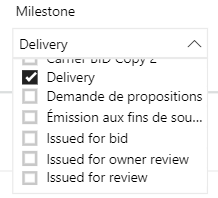
From the Milestone drop-down list, deselect all but the Delivery item.

The graph now changes:
Change the Date Range to a shorter period of time.
Click the light blue colored Forecasted Cumulative column for the tallest month. Your report should look like something like this:
 icon for a better view of the graph.
Click < Back to Report to return to the main view.
 icon, on the upper right side of the graph.
Notice now the two filters that appear, Date and MilestoneName. Click outside the box to close the dialog box.
The following table provides explanation of scheduled, forecasted, actual and cumulative (scheduled, forecasted and actual) packages at user-defined milestones.
| Term | Definition |
|---|---|
|
Project |
Identifies the project. |
|
Package Type |
Identifies the project options. |
|
Milestone |
Identifies the user-defined step in the project. |
|
Date Range |
Dates, as selected in the calendar. |
Click the Schedule Detail tab at the bottom of the page.
Right-click on any header, and then select Visual table to view the meta-data further.

Detailed data will appear:
Press <Back to report to return to the default view.
While some dashboard graphs offer the ability to Drill Up, Drill Down, Go to the Next Level of the Hierarchy, and Expand all down one level in the Hierarchy, most other graphs include the following options:
| Term | Definition | |
|---|---|---|
|
1 |
Filter | Filters and slices data in a visual. |
|
2 |
Focus mode |
Expand one visual in the dashboard. |
|
3 |
More options |
Opens additional options. |
|
4 |
Export Data |
Export data only to Excel (not visuals). |
|
5 |
Show as a Table |
Shows data/chart in a larger view. |
|
6 |
Spotlight |
Focuses dashboard on one specific visual. |
|
7 |
Sort descending |
Sort data in descending order. |
|
8 |
Sort ascending |
Sort data in ascending order. |
| 9 |
Sort by |
Allows you to sort by status or form. |
Additional Information
9977 N 90th Street, Suite 250 Scottsdale, AZ 85258 | 1-800-637-7496
© 2024 InEight, Inc. All Rights Reserved | Privacy Statement | Terms of Service | Cookie Policy | Do not sell/share my information
